Chart JS
This example renders a chart using Javascript with help of the chart add-on chart.js (http://chartjs.org).
Repository files
PDF files
| Converter | Status | PDF Preview |
|---|---|---|
| PDFreactor |

|
|
| PrinceXML |

|

|
| Antennahouse |
|

|
| Weasyprint |
|

|
| PagedJS |
|

|
| Typeset.sh |
|

|
| Vivliostyle |
|
|
| BFO |
|

|
HTML input
<!doctype html>
<html>
<head>
<title>Radar Chart</title>
<script src="Chart.js"></script>
<style>
/* workaround */
.chartjs-hidden-iframe {
visibility: hidden;
}
</style>
<script>
var data = {
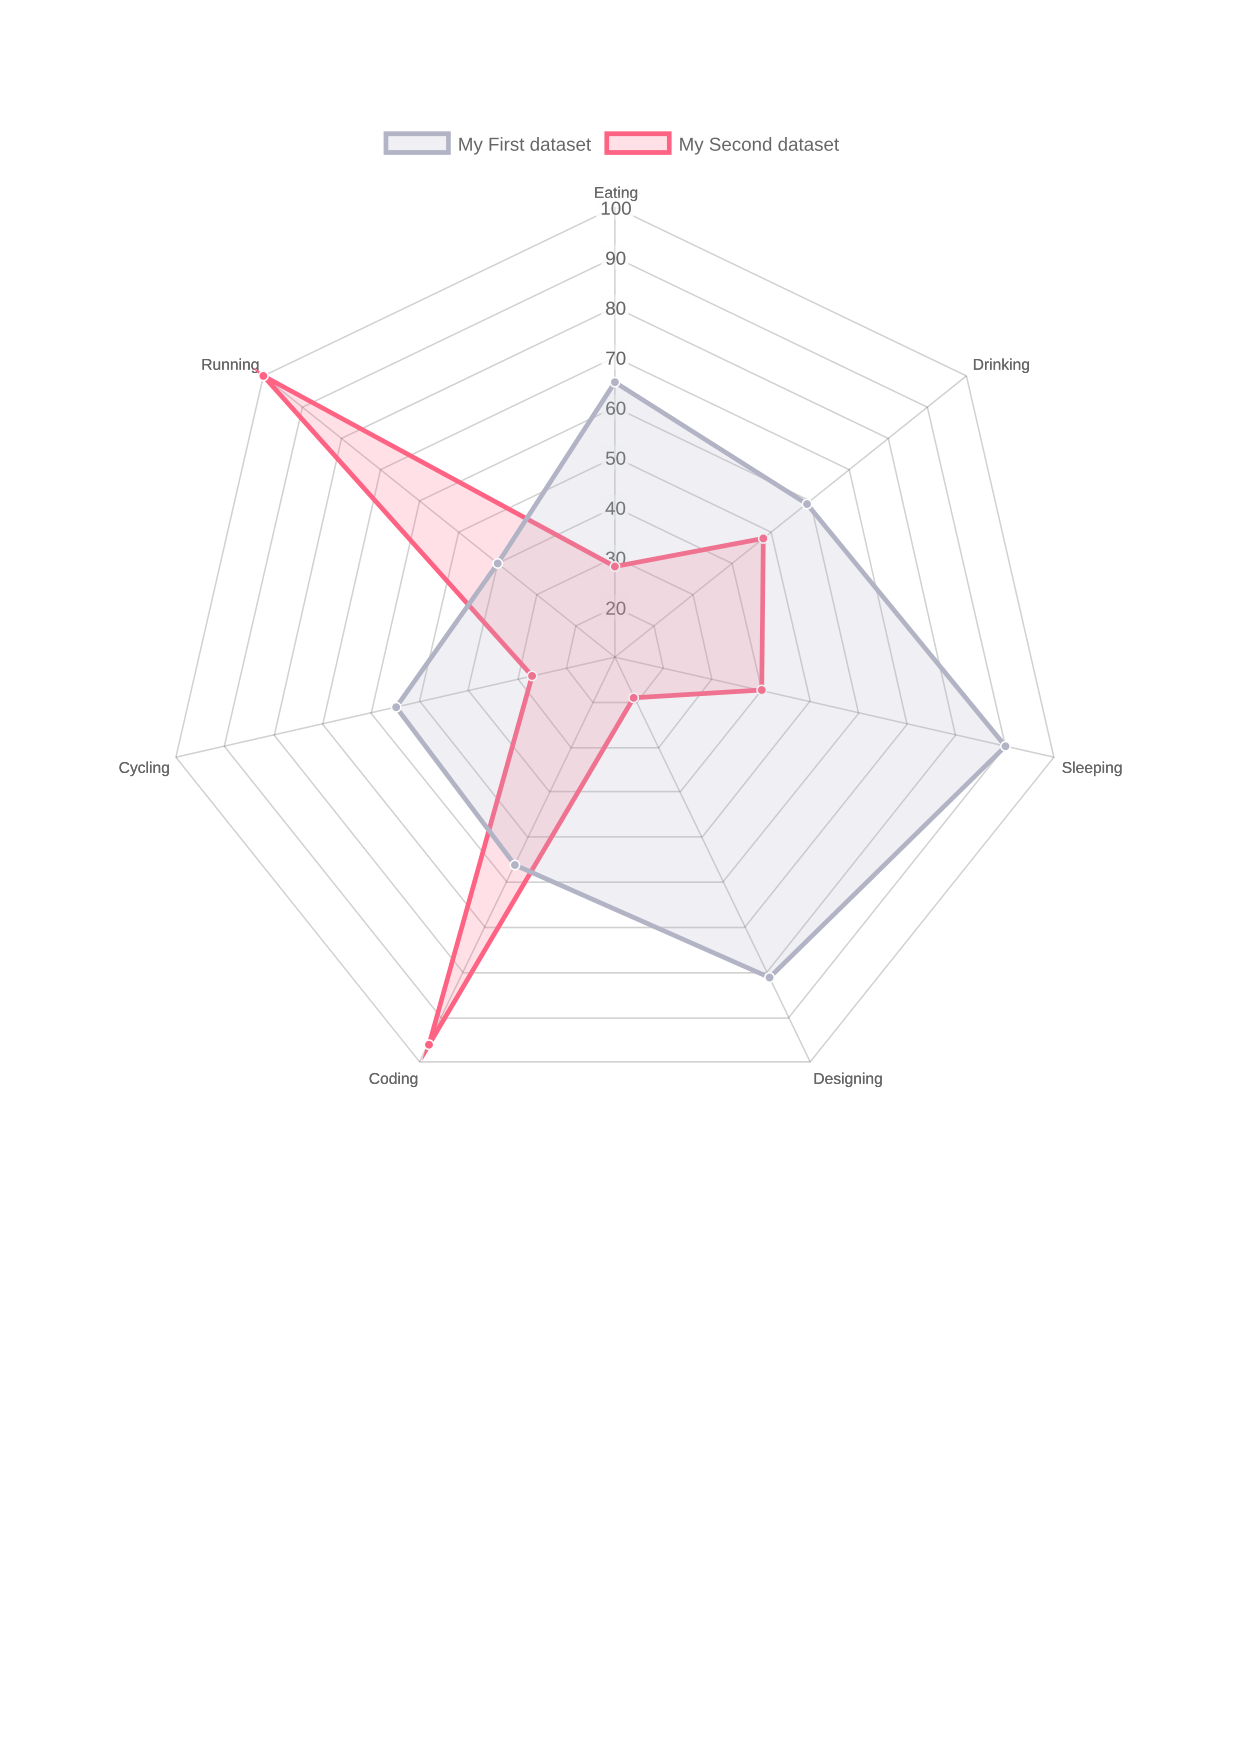
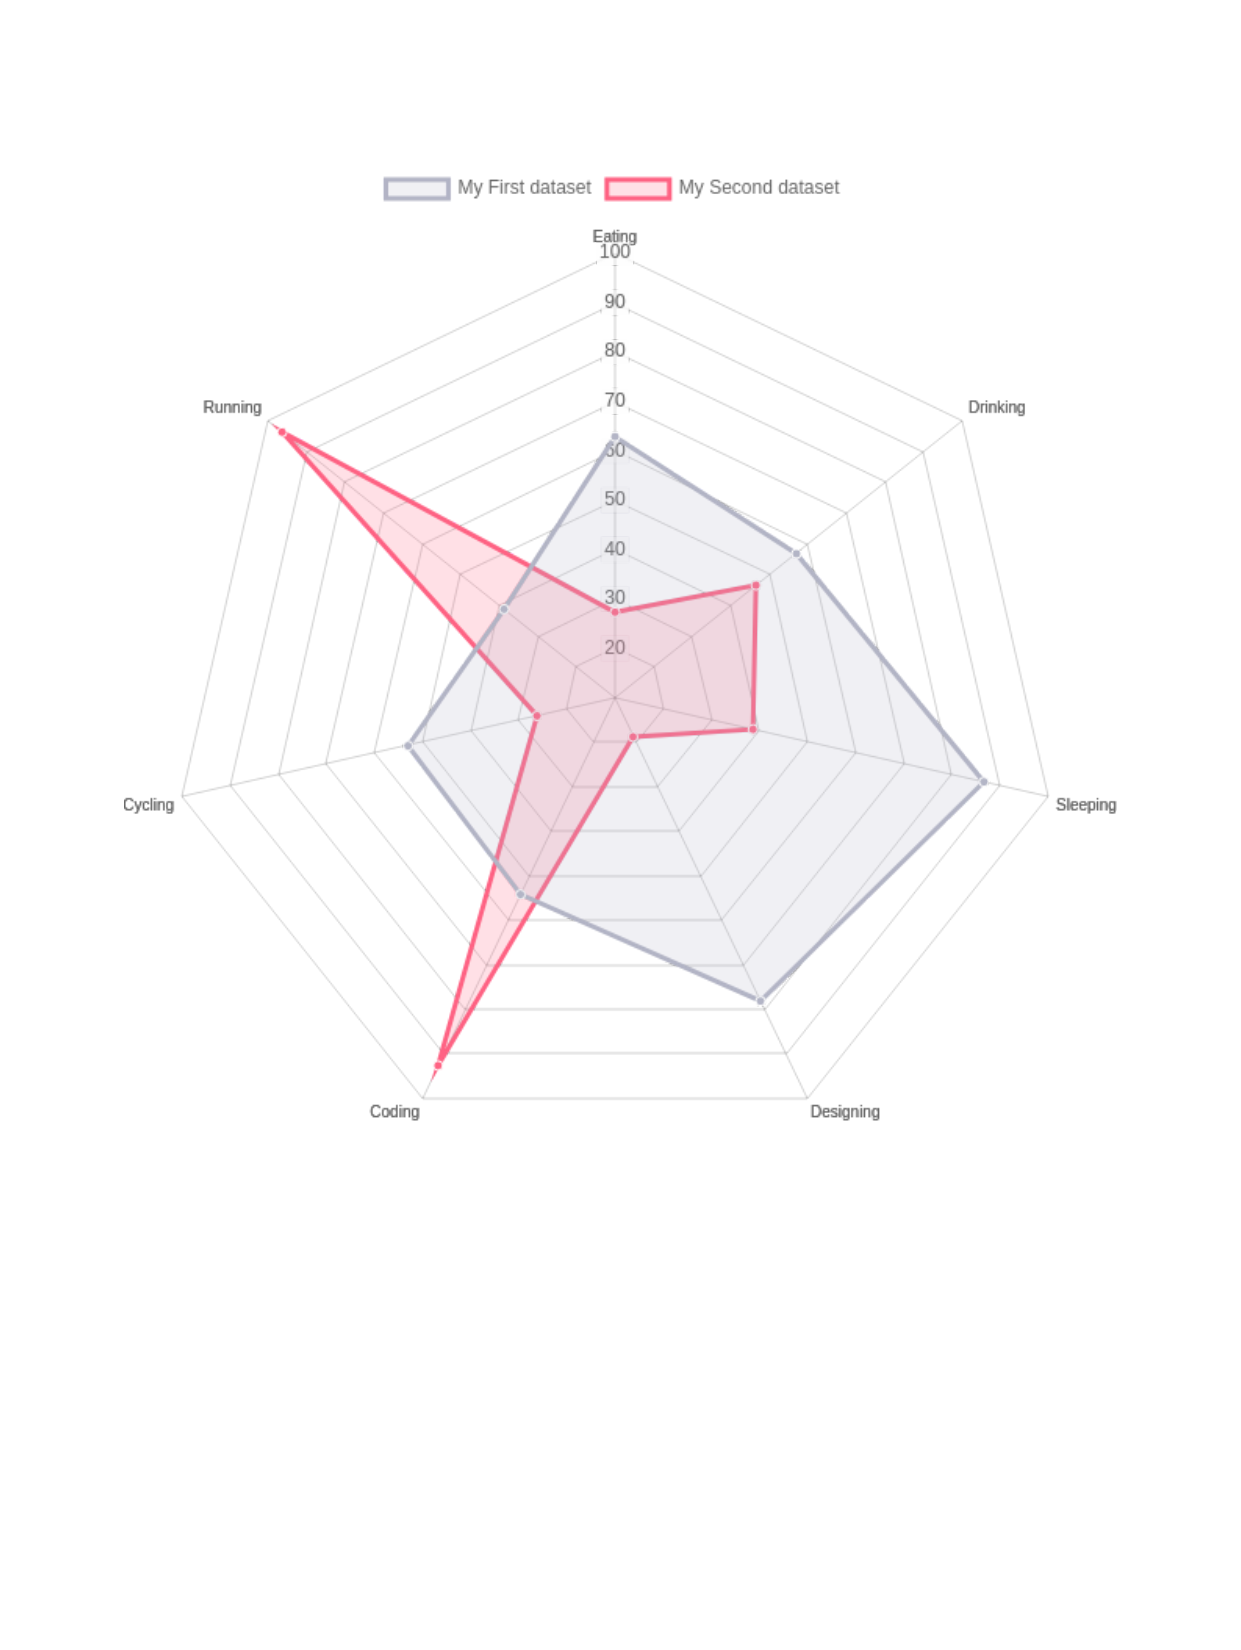
labels: ["Eating", "Drinking", "Sleeping", "Designing", "Coding", "Cycling", "Running"],
datasets: [
{
label: "My First dataset",
backgroundColor: "rgba(179,181,198,0.2)",
borderColor: "rgba(179,181,198,1)",
pointBackgroundColor: "rgba(179,181,198,1)",
pointBorderColor: "#fff",
pointHoverBackgroundColor: "#fff",
pointHoverBorderColor: "rgba(179,181,198,1)",
data: [65, 59, 90, 81, 56, 55, 40]
},
{
label: "My Second dataset",
backgroundColor: "rgba(255,99,132,0.2)",
borderColor: "rgba(255,99,132,1)",
pointBackgroundColor: "rgba(255,99,132,1)",
pointBorderColor: "#fff",
pointHoverBackgroundColor: "#fff",
pointHoverBorderColor: "rgba(255,99,132,1)",
data: [28, 48, 40, 19, 96, 27, 100]
}
]
};
window.onload = function(){
window.myRadar = new Chart('canvas', {
type: 'radar',
data: data
});
}
</script>
</head>
<body>
<div>
<canvas id="canvas" height="600" width="600"></canvas>
</div>
</body>
</html>